Dự báo thị trường có khả năng biến động như thế nào sau khi có thông báo, lập kế hoạch và giao dịch.
Các thông báo kinh tế diễn ra hàng ngày ảnh hưởng đến cách giá biến động. Làm thế nào để bạn tận dụng tối đa những cơ hội này? Phóng to dữ liệu trong quá khứ và có được thông tin chi tiết phù hợp để lập kế hoạch giao dịch của bạn. Hãy nắm rõ và đưa ra quyết định có tính toán. Economic Insight không phải là lịch kinh tế thông thường của bạn. Đây là một công cụ mạnh mẽ. Phân tích, lập kế hoạch và giao dịch trực tiếp từ đó.
Những điều cơ bản!
Trước tiên, hãy đảm bảo rằng bạn biết một số thông tin cơ bản để có thể sử dụng các thông báo kinh tế quả. Đừng lo lắng về các phép tính. Tất cả những điều này đều được thực hiện ngay tại chỗ cho bạn.
Pip
Đơn vị đo lường biến động giá theo cặp tiền tệ.
Biến động giá
Phần trăm thay đổi hàng ngày về giá của một cặp tiền tệ.
Phạm vi thực
Phạm vi thực là một chỉ báo đo lường mức độ biến động của giá tài sản. Chỉ báo này cho chúng ta biết giá thay đổi trung bình bao nhiêu trong một khung thời gian nhất định.
Đơn giản hóa!
Thông báo kinh tế chuyển đổi các phép tính Phạm vi thực sang Giá trị Pip
Chúng tôi xử lý dữ liệu phức tạp thành phân tích cấp độ ra quyết định đơn giản. Điều này giúp bạn hiểu rõ cách thị trường hoạt động. Economic Insight sử dụng chỉ báo “True Range” để tạo phân tích dữ liệu lịch sử. Sau đó, nó chuyển đổi các giá trị này thành “True Range Pips” để cho nhà giao dịch thấy quy mô biến động pip lịch sử đối với sự kiện kinh tế cụ thể.
Tại sao thêm Giá trị Pip vào thiết lập của bạn?
Giá trị Pip giúp nhà giao dịch hình thành chiến lược quản lý rủi ro vững chắc hơn. Chúng cũng giúp bạn xác định mục tiêu Chốt lời và Cắt lỗ rõ ràng hơn.
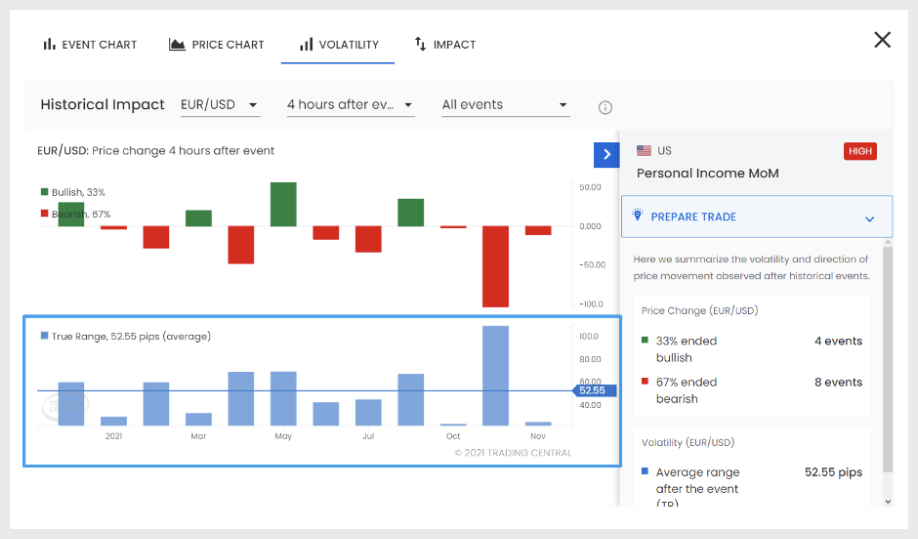
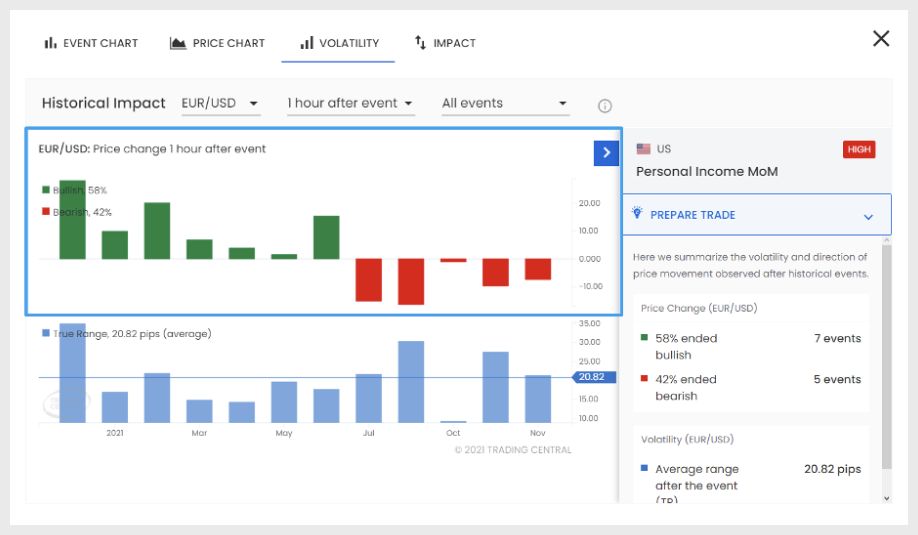
Tab Biến động
Chọn Cặp Tiền Tệ: Chọn từ danh sách các cặp tiền tệ liên quan đến sự kiện kinh tế.
Chọn Khung Thời Gian: Hiển thị dữ liệu biến động cho khung thời gian đã chọn sau mỗi sự kiện trong quá khứ.
Bộ Lọc Sự Kiện: Lọc sự kiện và dữ liệu dựa trên hiệu suất (Kết Quả Thực Tế vs Dự Đoán). Luôn có 3 kết quả có thể so với dự đoán và kết quả thực tế.
Kết quả thực tế thấp hơn dự đoán
Kết quả thực tế cao hơn dự đoán
Kết quả thực tế khớp với dự đoán
1
Phần Phạm Vi Thực Pip
Biểu Đồ Cột: Biểu đồ cột hiển thị Pip True Range lịch sử cho cặp tiền tệ và khung thời gian đã chọn. Nếu bạn đặt khung thời gian là “4 giờ sau sự kiện” cho một sự kiện xảy ra lúc 12:00, biểu đồ của bạn sẽ hiển thị sự biến động trong Pip True Range từ 12:00 đến 16:00.
2
Bullish (Tăng giá) and Bearish (Giảm giá)
Biểu đồ này cho thấy hướng giá của cặp tiền tệ đã chọn và khung thời gian đã chọn sau sự kiện kinh tế. Nếu bạn chọn “1 giờ sau sự kiện” cho một sự kiện xảy ra lúc 12:00, Economic Insight sẽ so sánh giá của cặp tiền tệ lúc 13:00 với giá lúc 12:00. Biểu đồ của bạn sẽ cho thấy những lần nào giá tăng và những lần nào giá giảm.
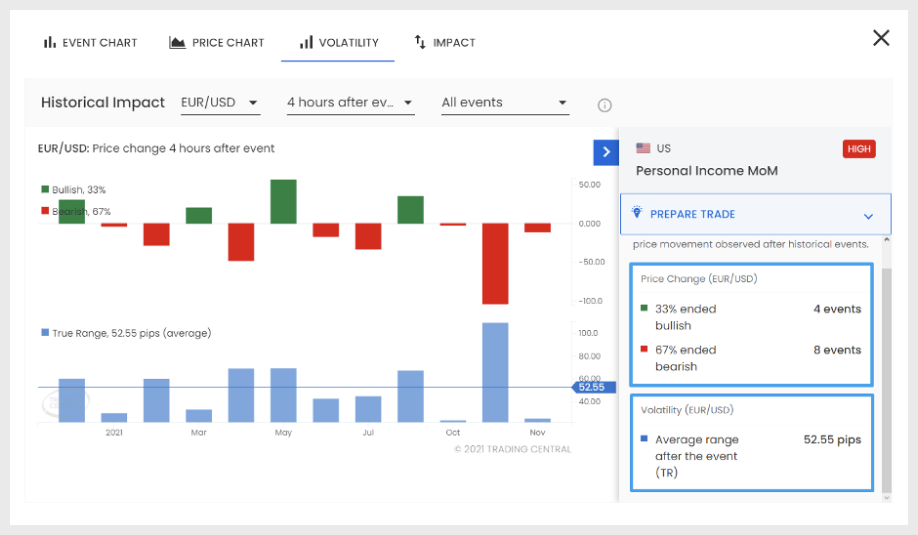
Kiểm tra sự phân chia giữa ảnh hưởng Bullish và Bearish và Biến Động Trung Bình trong Pip True Range từ 12 lần xảy ra gần nhất trong phần tóm tắt.
3
Tóm Tắt
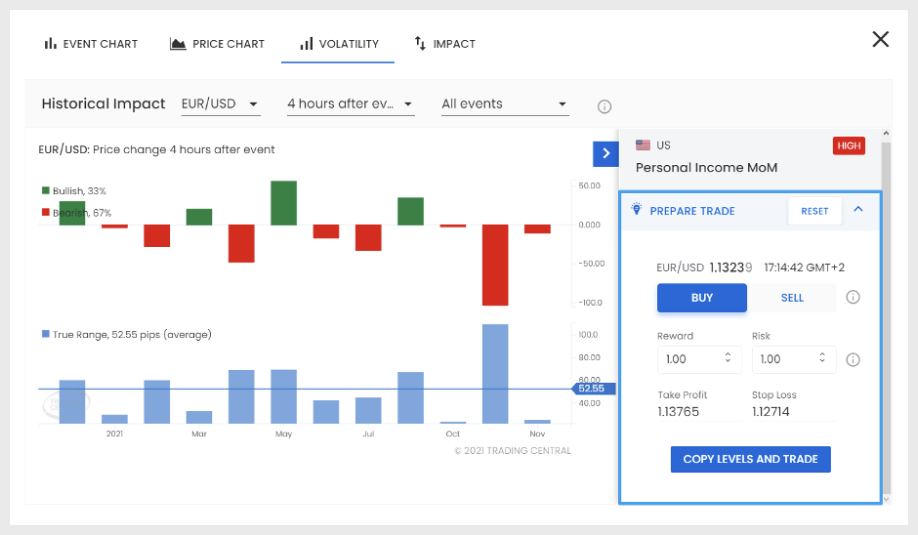
4
Thiết Lập Giao Dịch Của Bạn
Xem xét kết quả thực tế so với dự đoán và phản ứng của thị trường trong quá khứ đối với sự kiện kinh tế và quyết định xem bạn cần mua hay bán.
Nhấn nút “Sao Chép Mức và Giao Dịch” và thiết lập giao dịch của bạn sẽ được sao chép vào một lệnh mới sẵn sàng để thực hiện.
Economic Insight đọc giá thị trường hiện tại và tính toán tự động nơi đặt Take-Profit và Stop-Loss của bạn nên là gì. Điều này dựa trên tỷ lệ Rủi Ro/Lợi Nhuận mà bạn chọn và Pip True Range Trung Bình cho Khung Thời Gian đã chọn.
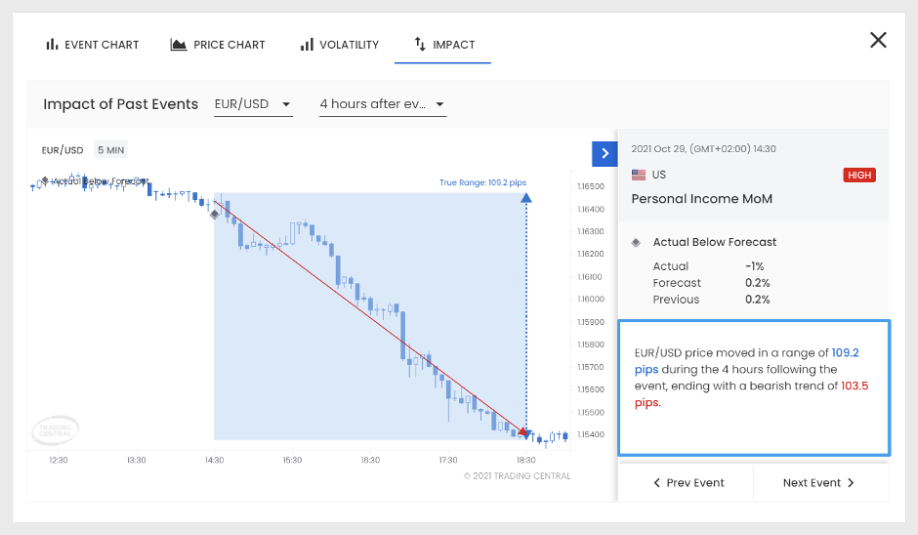
Tab ảnh Hưởng
Lướt qua các sự kiện trong quá khứ và phân tích cách thị trường đã hoạt động cho cặp tiền tệ và khung thời gian đã chọn của bạn. So sánh sự thay đổi giá thực tế với sự di chuyển Pip True Range cho 4 khung thời gian khác nhau để rút ra kết luận rõ ràng. Hình dung ảnh hưởng của sự kiện kinh tế trên biểu đồ nến.